3 Intermediate Tips
Data4All
3.1 Make it a Rectangle
Some datasets will not fit nicely into a single rectangle, but they will usually fit into a set of rectangles, in which case you can make a set of Excel files, each with a rectangle of data. It is best to keep each rectangle in its own file; tables scattered around a worksheet are difficult to work with, and they make it hard to export the data to CSV files.

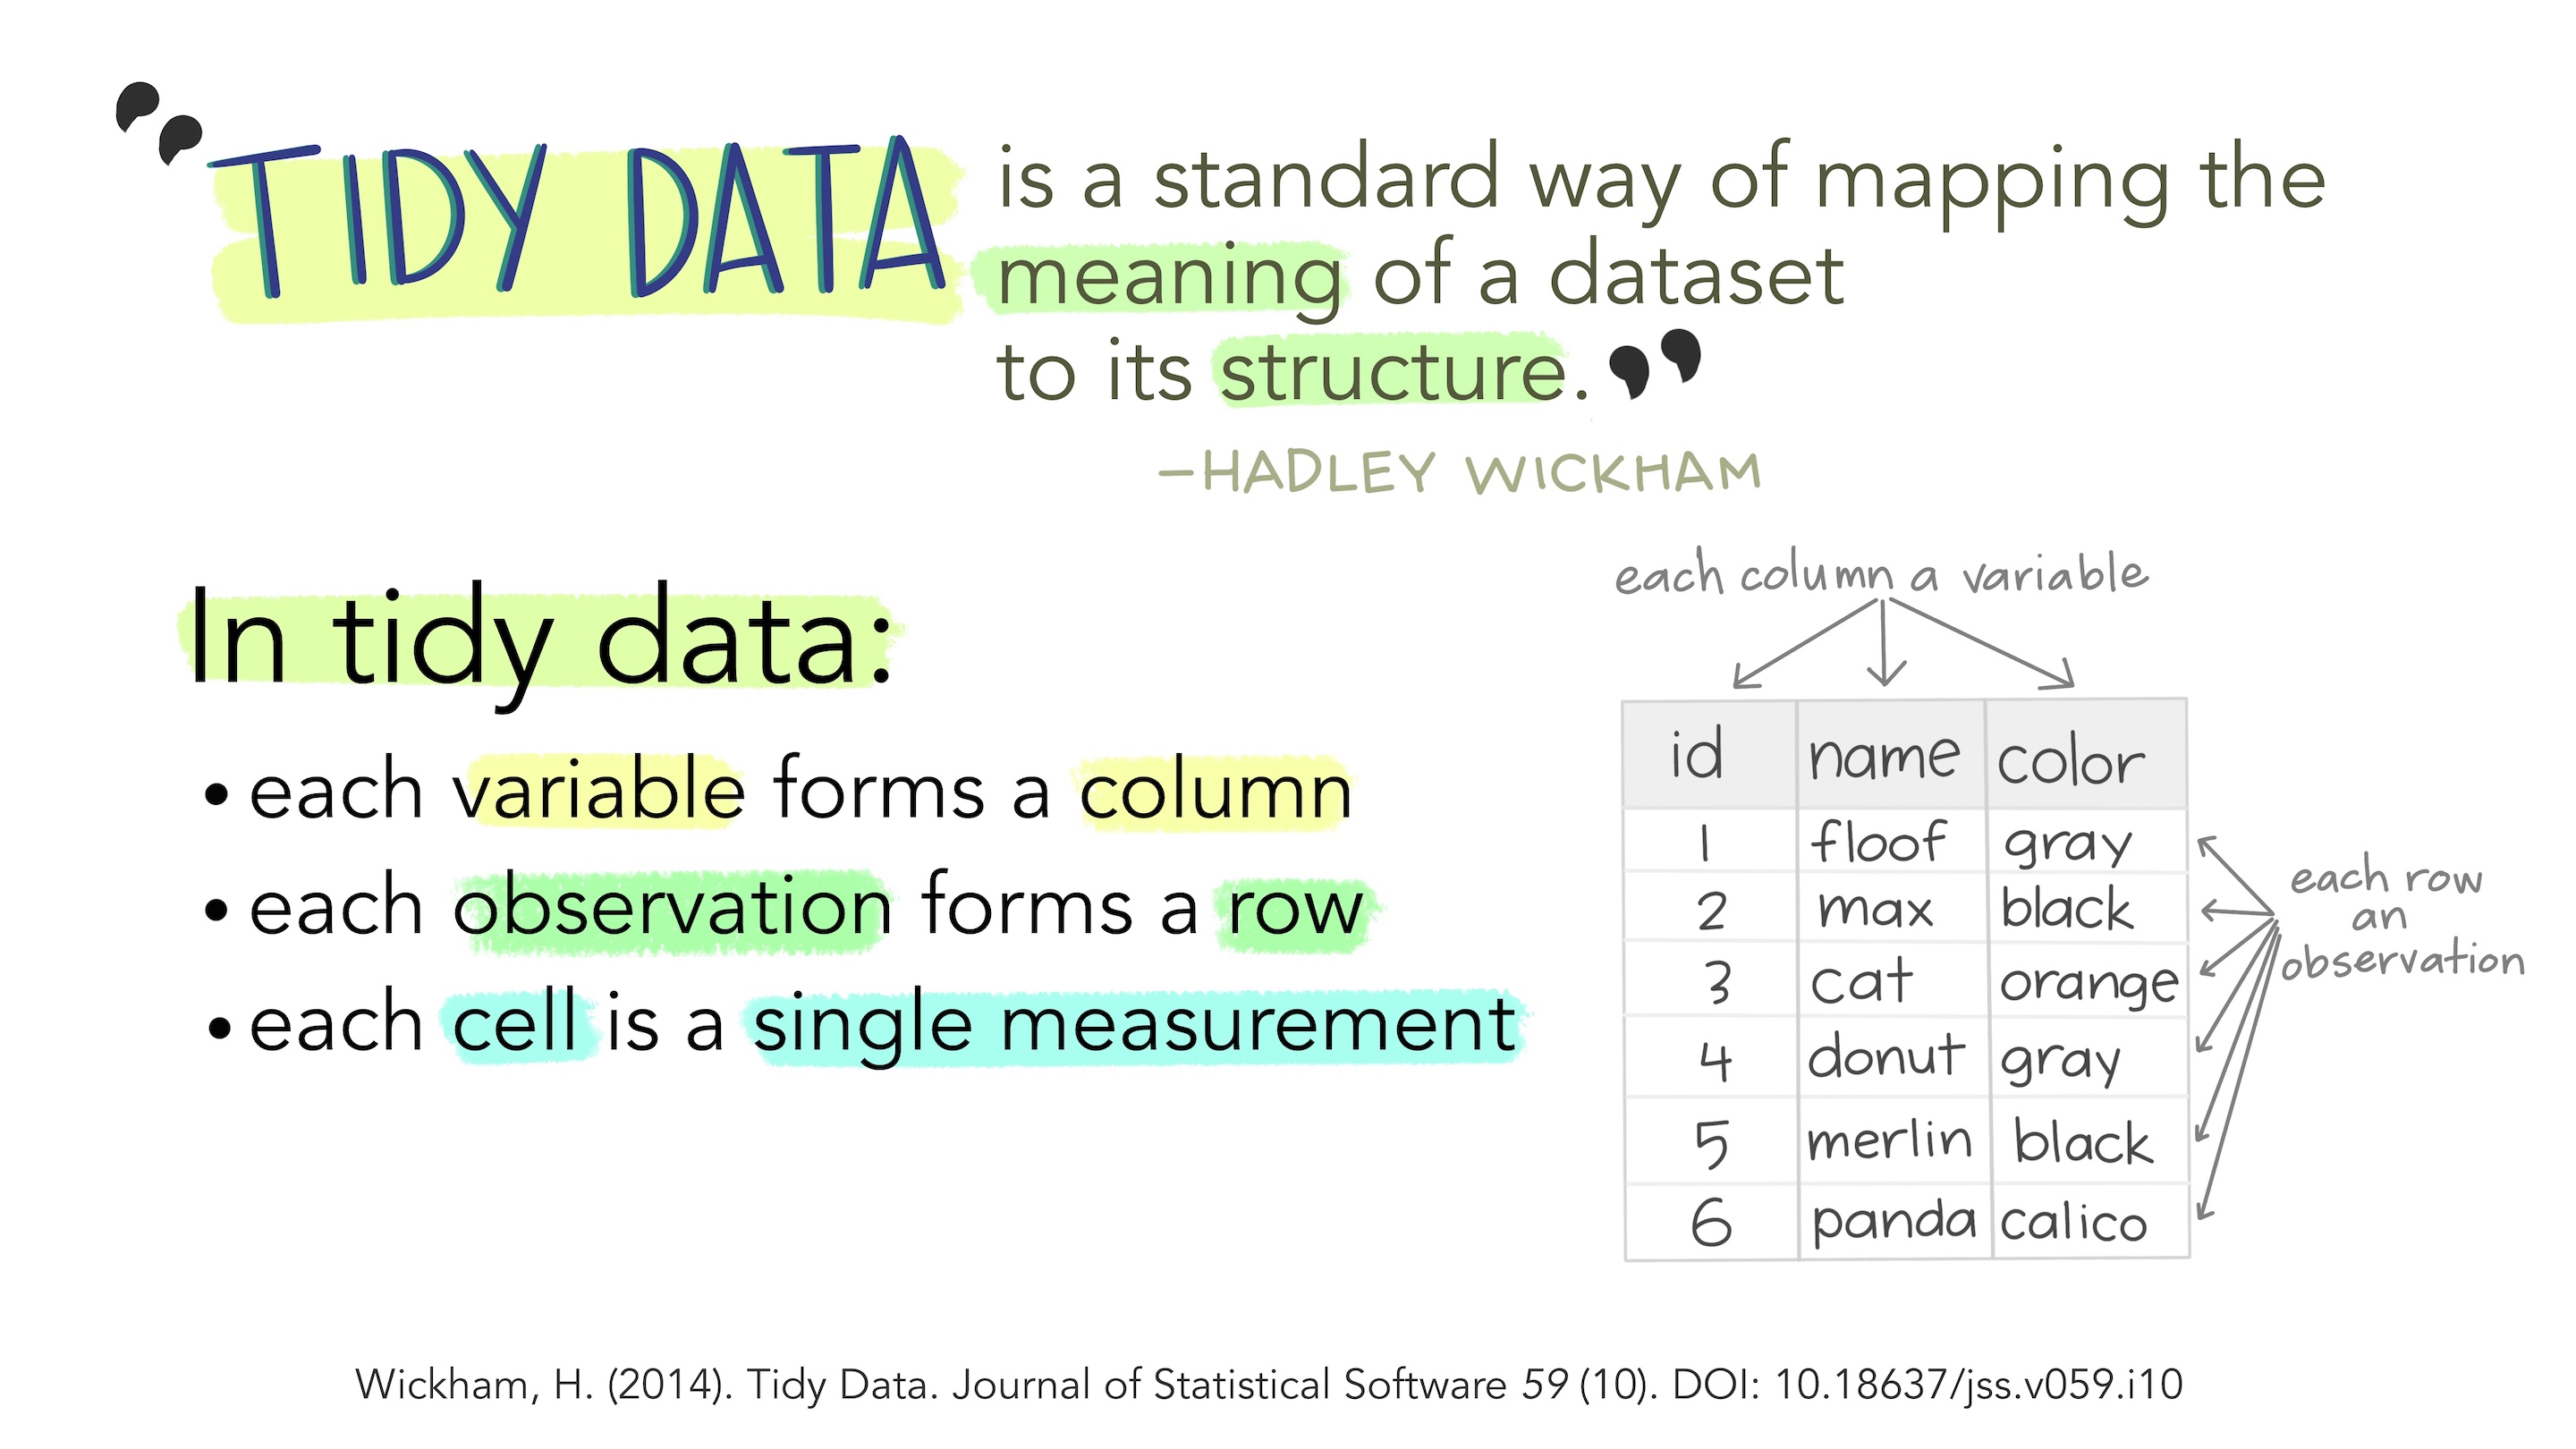
- Each variable forms a column
- Each observation forms a row
- Each cell is a single measurement
This is the data format that is the most flexible and lets you do the most with the data. Why?
Because we can work with variables as columns, and filter, and transform them easily.
3.1.1 Tidy can be in the eye of the beholder
Compare to the tidy format:
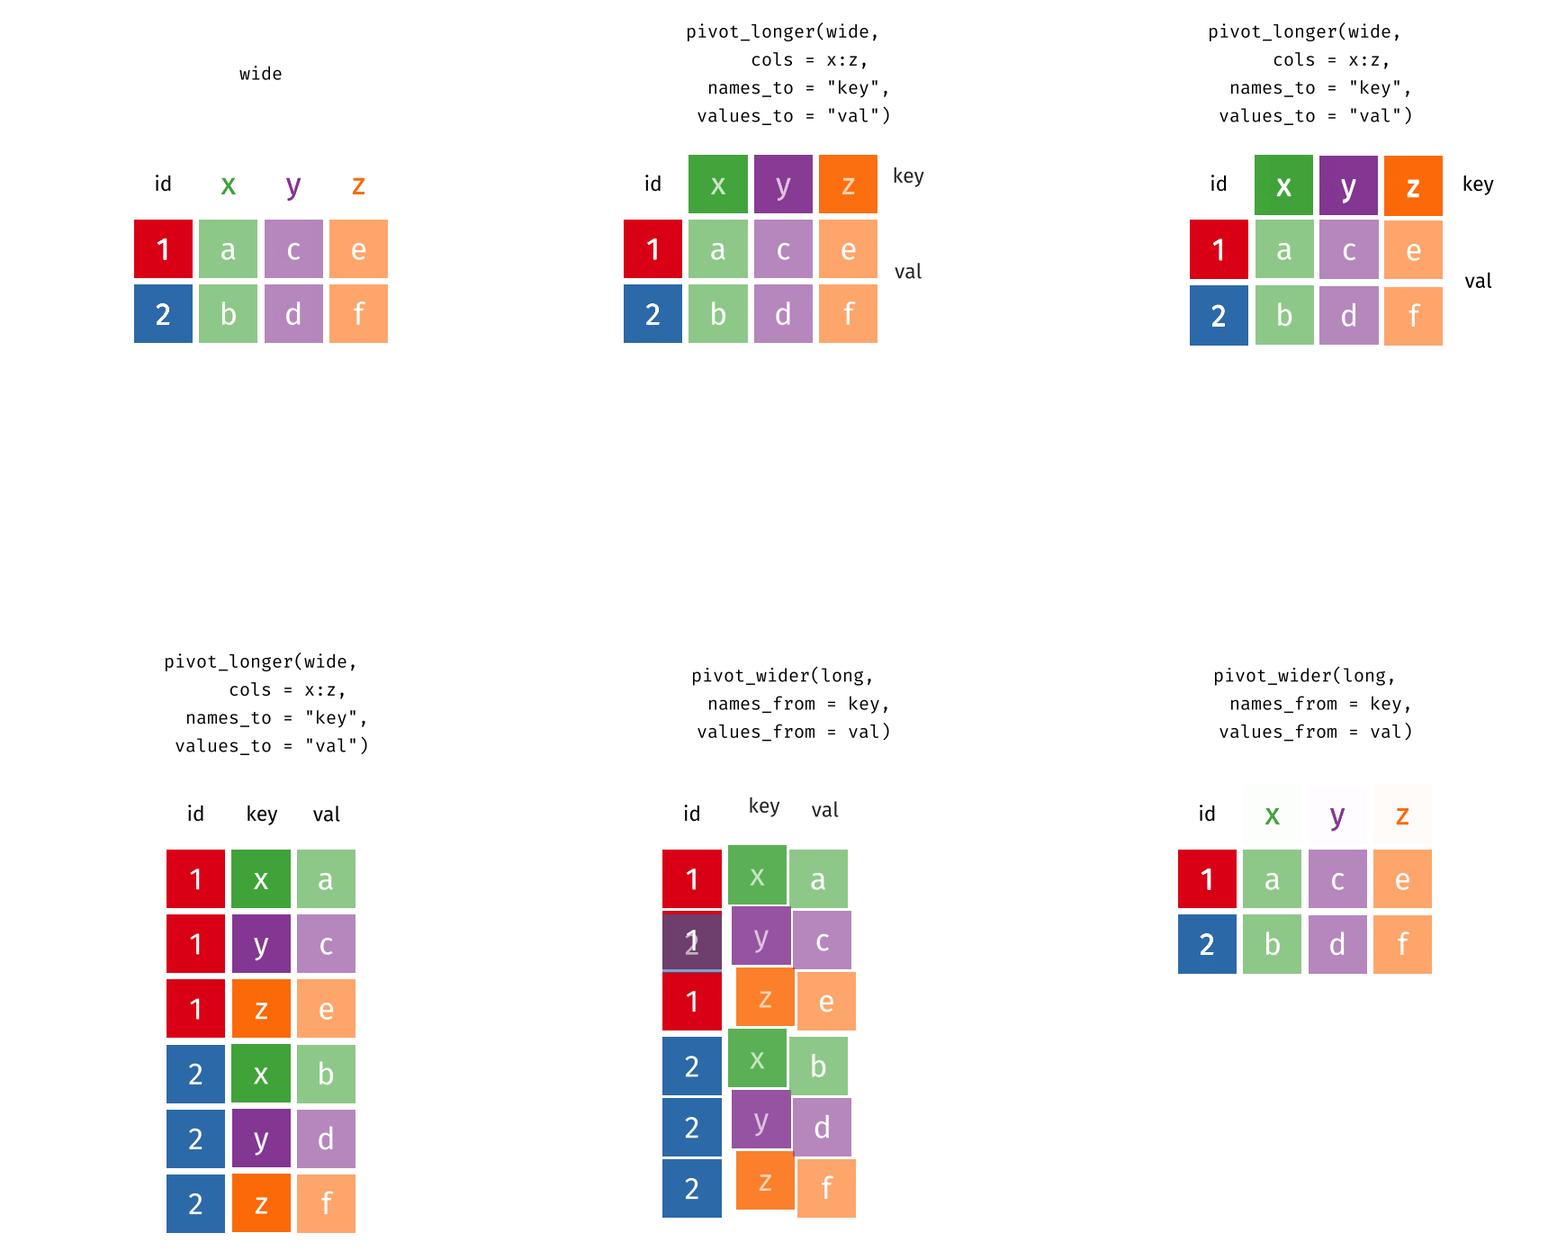
tidyr::pivot_longer() and tidyr::pivot_wider()
- In the
tidyrpackage,pivot_wider()andpivot_longer()are extremely useful ways to make a set of columns into a single column and vice versa. See the code above.

3.1.2 Tidy Data Examples
For example:
Sometimes you should try and separate tables, if you are repeating a lot of information.
3.2 Create a Data Dictionary
- Define your variables
- Describe the contents and formatting
- Define missing values
- Save as a separate text file
Metadata (data or information about the dataset) is extremely useful and is better saved in another file.
3.3 Do not use font color or highlighting as data
- Color is great, but if it conveys information you want a data scientist to utilize, put that information as a separate indicator column:
- Getting color data out of spreadsheets is extremely difficult (Visual Basic Macros)